Phenotypic Age as a Routine Lab-Based Clock
A blood test that reveals how fast your body is actually aging.
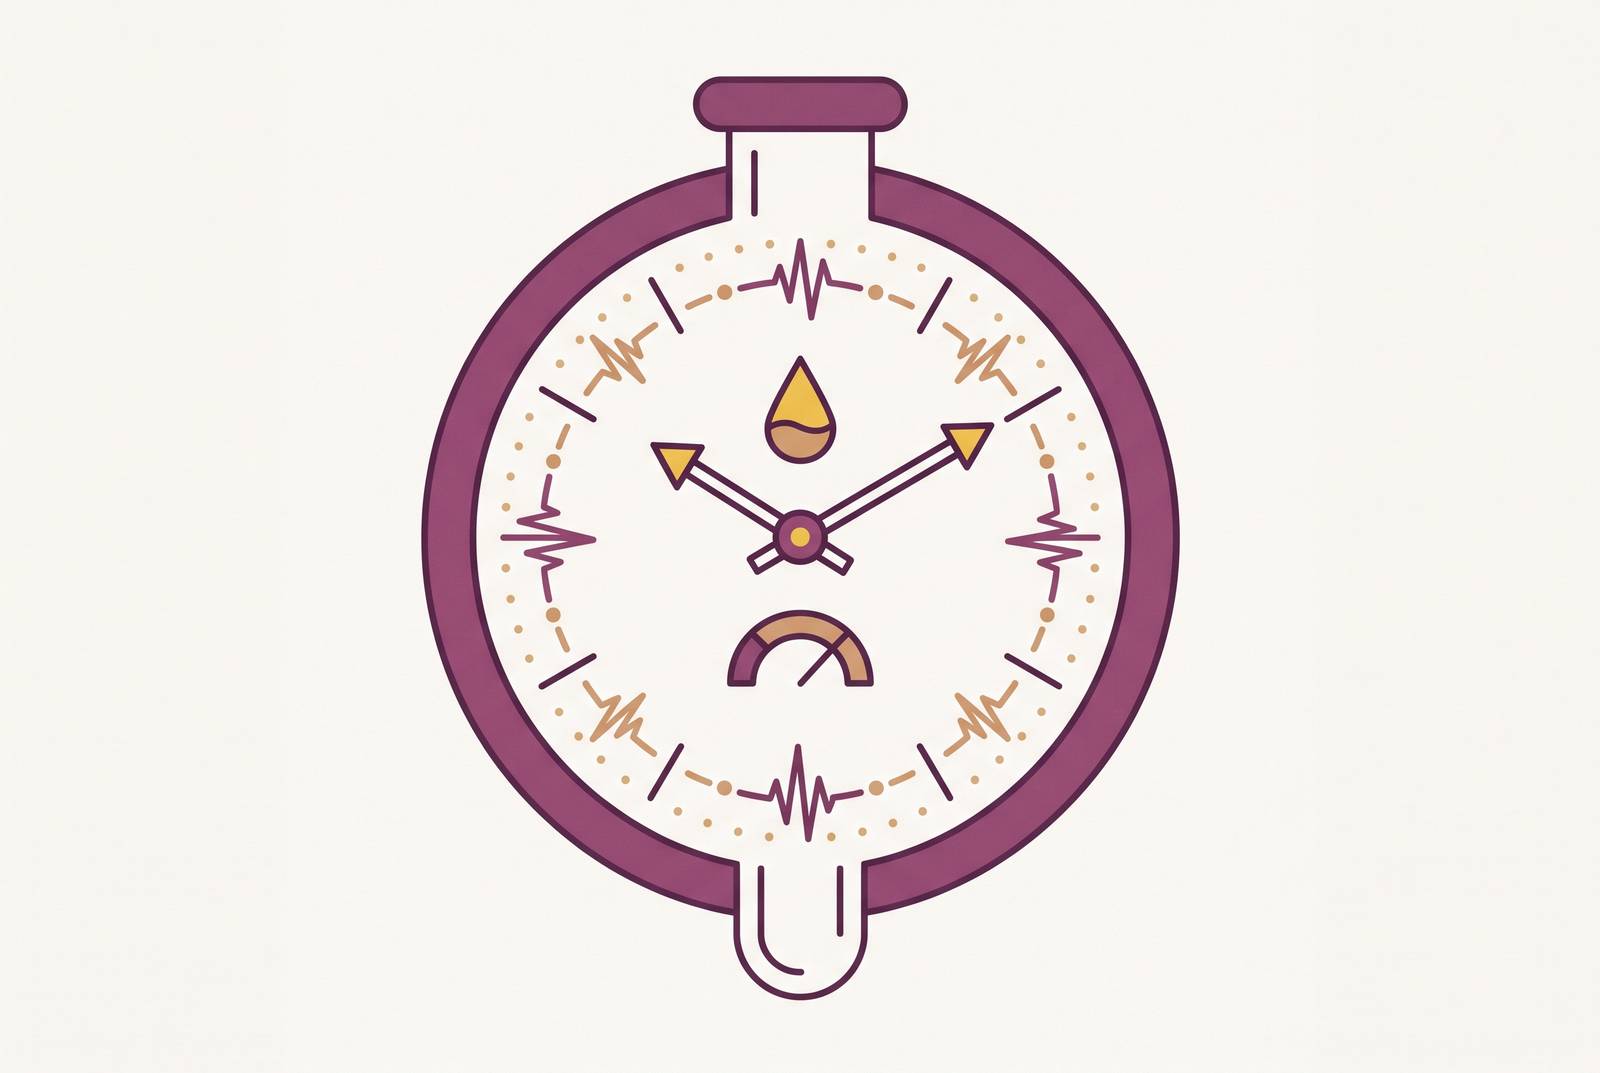
Chronological age tells you how long you've been alive. It says nothing about how much wear your body has actually accumulated. Two people born in the same month can carry very different amounts of metabolic, inflammatory, and immune damage, and that gap, not the birthday, is what predicts whether one of them develops heart disease a decade before the other. An eBioMedicine editorial from February 2026 puts this divergence at the center of modern aging research, noting that people of identical chronological age can differ by ten years or more in biological age, depending on how their metabolic, inflammatory, and immune systems are holding up.
None of that appears on a birth certificate. A routine annual physical summary doesn't capture it either, since it tends to flag individual values as normal or abnormal without asking how they move together over time. So two patients can walk out of the same clinic with the same chronological age and the same clean bill of health, while one of them is quietly on a faster track toward disease. Standard care has no mechanism for catching that, because it was never built to measure the rate of aging, only to track whether specific numbers cross a threshold. That raises an obvious question: is there a way to actually quantify the gap, using tools a regular blood draw already produces?
What PhenoAge Is
Phenotypic Age, known as PhenoAge, answers that question with a composite score built almost entirely from standard bloodwork. It was developed by Morgan Levine and colleagues and published in 2018, and the clinical version of it runs on nine biomarkers a routine blood panel produces, with one exception: high-sensitivity CRP typically has to be ordered as a separate test rather than arriving automatically on a standard panel.
The model behind PhenoAge was built on the NHANES III cohort. Researchers started with 42 candidate biomarkers, and they used a Cox Proportional Hazard Elastic Net model to narrow that list down to the nine that, in combination, best predicted ten-year all-cause mortality. Those nine values were then fed into a Gompertz proportional hazard model to generate the final age estimate. The result wasn't just validated once. PhenoAge was independently tested against NHANES IV, and a related version built on DNA methylation data, called DNAm PhenoAge, was further validated in both the Women's Health Initiative and the Framingham Heart Study. That breadth of testing across multiple independent cohorts separates PhenoAge from a lot of biological age measures that get proposed and never get checked against outcomes beyond the dataset they were built on.
DNAm PhenoAge is the methylation-based version, built by applying the same phenotypic composite logic to DNA methylation data instead of blood chemistry, distinct from the clinical version calculated from blood values. The version most people encounter at a lab, the one this piece is about, is the clinical or phenotypic version, calculated directly from nine routine blood values. No methylation assay required. The score comes out expressed as an age in years: if your PhenoAge lands below your actual age, your blood work collectively looks younger than you are. If it lands above, the reverse is true. PhenoAge sits inside a wider field of aging clocks, including the Horvath pan-tissue clock, the Hannum blood clock, the mortality-trained GrimAge, and the pace-of-aging tool DunedinPACE. What sets PhenoAge apart from that group is simple: it runs on standard clinical lab values, the kind a basic blood draw already generates, with no DNA sequencing involved.
What each of the nine markers measures
The nine markers in PhenoAge were not chosen for convenience. Together, they cover five separate physiological domains: nutrition and organ function, metabolic health, systemic inflammation, immune competence, and red blood cell quality. Aging doesn't damage one system in isolation. It wears down several at once, and a score that triangulates across five domains catches that in a way that a cholesterol number or a glucose reading alone cannot.
Albumin, with an optimal range of 4.0 to 5.0 g/dL, reflects how well the liver is synthesizing protein and how well-nourished the body is overall. A downward drift in albumin can point to malnutrition, but it can also reflect chronic systemic stress even in someone eating well. Creatinine works as a stand-in for kidney filtration. When it rises, it usually means the kidneys are filtering less efficiently, which often traces back to cardiometabolic or inflammatory strain building elsewhere in the body. Fasting glucose tracks metabolic health and insulin sensitivity directly, and longitudinal research has confirmed that it actively accelerates biological aging when elevated, so it's one of the more modifiable levers in the whole panel.
C-reactive protein, measured as hs-CRP with an optimal level under 1.0 mg/L, captures low-grade systemic inflammation. It ranks among the most consistent upstream drivers of aging across every tissue in the body. A unit mismatch matters here: the original PhenoAge model was built using CRP measured in mg/dL, but US labs typically report hs-CRP in mg/L, a unit an order of magnitude larger. Many online calculators skip the conversion, which inflates the final score. If you're running your own numbers through a calculator, check which unit it uses before you trust the result.
Lymphocyte percentage reflects immune competence, and a decline in it signals immunosenescence, the gradual erosion of adaptive immune function that comes with age. Mean cell volume measures the average size of red blood cells, and when it drifts outside normal range, it can point to nutritional gaps in B12 or folate, or early bone marrow dysfunction. Red cell distribution width measures how much variation exists in red blood cell size, and elevated RDW consistently predicts mortality risk while reflecting systemic stress and inflammation. Alkaline phosphatase, a liver and bone enzyme, climbs when there's hepatic stress or accelerated bone turnover. White blood cell count rounds out the panel as a broad inflammation and immune activation marker. Even when WBC sits inside the normal reference range, higher counts within that range still track with a higher biological age.
These markers don't move independently of each other. In patients with degenerative spine disease, researchers observed accelerated PhenoAge scores accompanied by elevated CRP and WBC together, a clear example of how one upstream problem, chronic systemic inflammation, ripples outward and inflates several markers in the panel at once rather than just one. That's useful to know because it means a high PhenoAge score usually has a story behind it, not just a number. And the practical overhead here is lower than people expect: a standard annual check-up that includes a complete blood count, hs-CRP, fasting glucose, albumin, creatinine, and ALP already covers all nine values. The one piece most often missing from a standard comprehensive metabolic panel is hs-CRP, worth asking for by name.
What a gap between PhenoAge and chronological age predicts
A PhenoAge that runs higher than chronological age isn't an abstract warning sign. It correlates with measurably higher rates of cardiovascular disease and all-cause mortality across large, independently validated cohorts, which is what separates PhenoAge from a wellness metric that sounds meaningful but doesn't connect to outcomes.
The clearest evidence comes from cardiovascular disease. A Scientific Reports analysis of UK Biobank data found that incident cardiovascular disease occurred in 44.8% of the group with accelerated PhenoAge, and it occurred over a shorter follow-up period than in the group whose biological age matched or trailed their chronological age. In that same analysis, PhenoAge acceleration beat chronological age as a predictor of cardiovascular disease. It did not yet outperform established composite risk tools like the Framingham Risk Score when used on its own, and that qualification matters. PhenoAge adds information, but it hasn't replaced the risk calculators clinicians already rely on.
The pattern holds in a higher-risk population too. In people with hypertension, elevated PhenoAge and PhenoAge acceleration significantly predict higher rates of both all-cause and cardiovascular mortality, so the score works as a risk-stratification tool in a group that's already managing elevated cardiovascular risk. The logic connecting all of this back to the nine markers is straightforward: PhenoAge captures cumulative physiological burden across five systems at the same time, and that simultaneous view is what lets it add predictive power beyond any single risk factor, and beyond chronological age itself.
PhenoAge is a research-grounded metric for educational use rather than clinical diagnosis. A single panel is a snapshot, lab values shift with the assay used and with day-to-day physiological fluctuation, and the resulting number functions as an educational estimate rather than a diagnosis. But a snapshot still carries information. The same logic applies to a cholesterol reading or a blood pressure check: one measurement doesn't settle anything on its own, but it justifies follow-up, especially when the gap between biological and chronological age is large. If the score is actionable at that point, the next question follows naturally: what actually moves it?
What the intervention evidence shows can move the score
PhenoAge responds to changes in daily behavior, and the evidence for that now includes randomized controlled trials, not just observational correlation. A high score marks a starting point for action.
The strongest evidence comes from a 2026 randomized controlled trial (NCT06440681, run out of King Saud University) involving adults with prediabetes. The intervention combined roughly five percent body-weight loss, four hours of exercise per week, reduced fat intake, and a high-fiber eating pattern. The intervention group's PhenoAge dropped by 4.9 years, but the control group's PhenoAge rose by 1.3 years, and the between-group difference had a p-value under 0.001. Because the trial was randomized and specific about what the intervention involved, it stands as the clearest single piece of evidence that PhenoAge is a movable target.
Other research points in the same direction. A University of Sydney study found that a four-week dietary change made some older adults appear biologically younger on key aging biomarkers, with the strongest effects coming from a lower-fat, higher-carbohydrate eating pattern, and additional improvement among participants who shifted toward more plant-based protein. A broader review in Frontiers in Genetics looked across 41 human interventional studies and found that exercise, plant-rich diets, caloric restriction, omega-3 fatty acids, and multivitamin-multimineral supplementation were all associated with decreases in epigenetic age. And in a 2023 study in Aging Cell, just four weeks of high-intensity interval training significantly reduced participants' transcriptomic age score, a measure of how fast aging is proceeding rather than a static snapshot of it. That result matters because it shows exercise can slow the rate of aging itself, not just produce a one-time improvement in a single reading.
The accelerants run in the opposite direction. A longitudinal multi-cohort study published in eBioMedicine identified smoking, higher BMI, elevated glucose, and poor blood pressure profiles as factors that speed up biological aging, measured using epigenetic tools including DunedinPACE. Physical activity and a healthier diet slowed it in the same analysis. What connects nearly all of this evidence is mechanism: most interventions that lower PhenoAge work by reducing systemic inflammation and improving metabolic function, which happen to be the exact systems the CRP, WBC, glucose, and albumin markers in the PhenoAge panel are built to track. The evidence base is growing, but researchers are still working out which interventions matter most for which people, and anyone reading these trials should treat them as promising direction rather than a settled prescription.
How PhenoAge compares to other biological age tools
PhenoAge occupies a specific niche in a crowded field of aging clocks: it delivers a validated biological age estimate from a standard blood draw, without the cost or technical complexity that comes with a DNA methylation assay.
The methylation-based clocks, as a May 2026 Biogerontology review lays out, each carry their own tradeoffs. The Horvath pan-tissue clock uses 353 CpG sites and works across different tissue types, so it was the first clock of its kind to apply broadly. It's accurate for predicting chronological age but less oriented toward predicting actual health outcomes. The Hannum clock, published in 2013, is blood-specific and built on 71 markers. DNAm PhenoAge, the methylation-based sibling of the clinical PhenoAge score discussed throughout this piece, trains on the same phenotypic composite and performs better than first-generation clocks at predicting health outcomes specifically. GrimAge, trained directly on mortality data, consistently ranks as the strongest predictor of death among the methylation clocks. DunedinPACE works differently from all of these: rather than producing a static age estimate, it measures the pace of aging itself, and it has shown high test-retest reliability, making it well suited to tracking change over time.
The tradeoff with GrimAge and DunedinPACE is accessibility. Both require high-throughput DNA methylation arrays, and the same Biogerontology review points out that relying on large numbers of CpG sites and high-throughput sequencing technology limits how broadly these tools can scale in clinical settings, given the cost, the technical complexity, and the sample processing involved. PhenoAge's blood-based version sidesteps all of that, though it comes with its own limitation: it captures systemic markers across five physiological domains, but it doesn't see the tissue-specific methylation patterns that GrimAge or DunedinPACE can detect. It's a broader signal, drawn from the whole body's metabolic and inflammatory state, rather than a deeper one at the level of individual tissues.
The field keeps moving. A nucleosome-positioning clock built from cell-free DNA emerged in 2024, and clocks based on histone modifications followed in 2025, both described in the epigenetic clock literature as promising alternatives to the cytosine-methylation approach that's dominated the field so far. For now, though, PhenoAge remains the option that turns a standard blood draw into a validated estimate of how fast someone is actually aging, which is exactly the practical foothold a reader needs before deciding whether to dig further into the more specialized, more expensive tools sitting next to it on the shelf.