Fasting Insulin as an Early Metabolic Aging Signal
Early pancreatic compensation reveals metabolic decline before standard glucose tests catch it.

A person can walk out of an annual physical with a clean fasting glucose number, a body weight measurement that falls in the normal range, and a doctor who tells them everything looks fine. Metabolic aging can already be underway for years beneath that reassurance, driven by the pancreas compensating for resistance, with no marker on the standard panel built to catch it. Fasting insulin is the test built to catch it. It picks up the compensatory phase of metabolic decline, the stretch of time when the pancreas is working harder than normal to force glucose into resistant cells, long before glucose or HbA1c show a single sign of trouble.
Doctors run fasting glucose first, and if that looks off, they follow up with HbA1c. Both are lagging indicators. Glucose only rises once the pancreas can no longer keep pace with demand, and HbA1c just gives you a three-month average of damage that already happened, not damage in progress. The Levels 2026 metabolic health guide notes that as you age, your glucose tolerance drops and your risk of insulin resistance and type 2 diabetes rises, so advanced testing like fasting insulin can give you a fuller picture than the standard markers alone.
BMI adds its own blind spot on top of this. Some people at a normal weight carry real metabolic dysfunction under the surface, but some people with obesity keep strong insulin sensitivity despite the extra weight. Weight-based screening misses both groups. Insulin resistance usually appears years before a type 2 diabetes diagnosis, so you have a long runway to make simple, low-effort changes, but you only see that runway if you actually order the test. Functional and preventive medicine practitioners have been including fasting insulin in routine panels for exactly this reason: it flags the problem at the stage when fixing it is still easy.
How the pancreas changes first
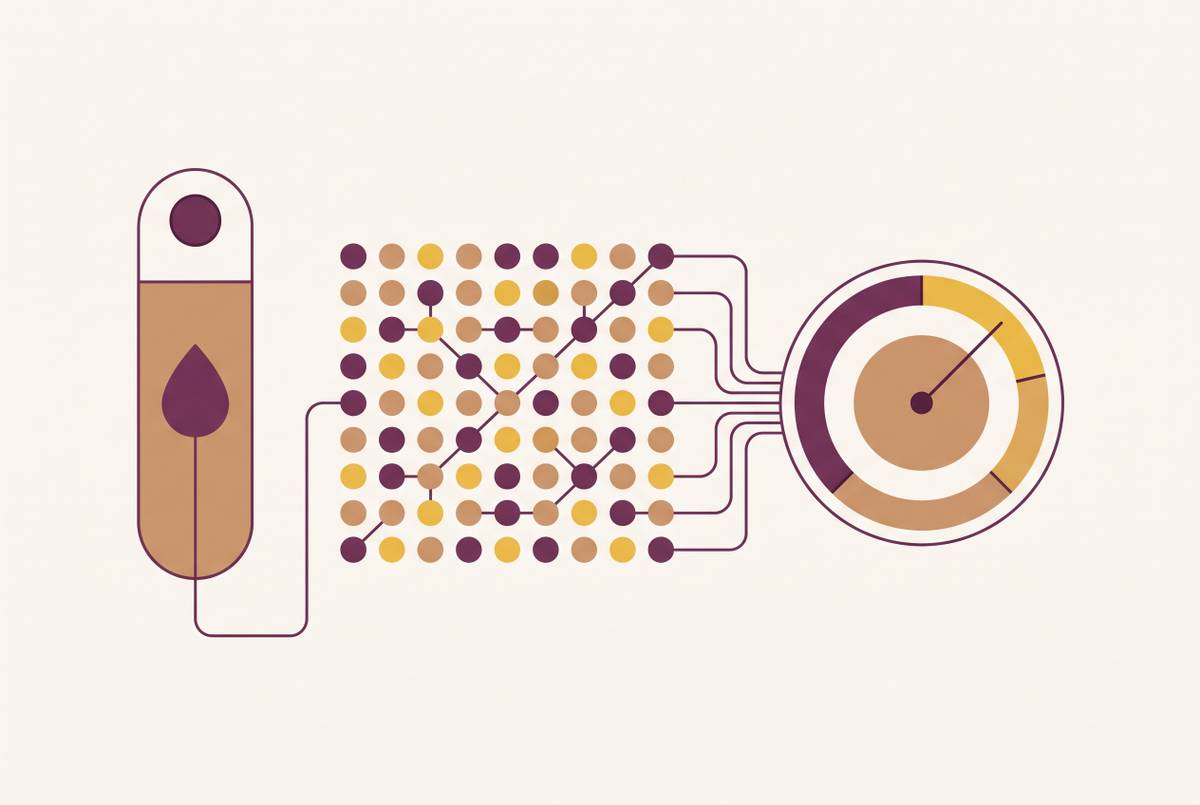
You go at least eight hours without food, and fasting insulin measures how much insulin is left in your blood. It is a readout of the background effort the pancreas puts in just to hold glucose steady while the body is at rest, not a response to a meal.
When cells start resisting insulin's signal, the pancreas answers by pumping out more of it. That extra output is hyperinsulinemia, and it's usually the first sign measurable in blood; some evidence suggests it may appear even before the resistance itself takes hold. The relationship seems to run in both directions. Genetic background, diet quality, and sustained over-nutrition can push insulin secretion up or slow the liver's ability to clear insulin from the blood, and that excess insulin can then go on to drive the resistance. Either way, a fasting insulin number that creeps upward can flag the problem well before any disturbance appears in glucose.
Aging adds its own pressure to this system, separate from diet or exercise habits. Cellular senescence plays a direct role here. Senescent cells send out pro-inflammatory signals that get in the way of insulin's work in nearby tissue, so metabolic aging and cellular aging end up feeding each other.
Resistance also doesn't develop the same way everywhere in the body. The liver, skeletal muscle, and fat tissue each build resistance through different pathways and on different timelines. Muscle resistance matters most for clearing glucose after a meal. Liver resistance matters most because it keeps glucose suppressed overnight and between meals. Resistance in visceral fat drives the lipid abnormalities that raise cardiovascular risk. Three organs, three separate clocks, but they all feed into the same number on a lab report.
Why the standard lab range is the wrong benchmark
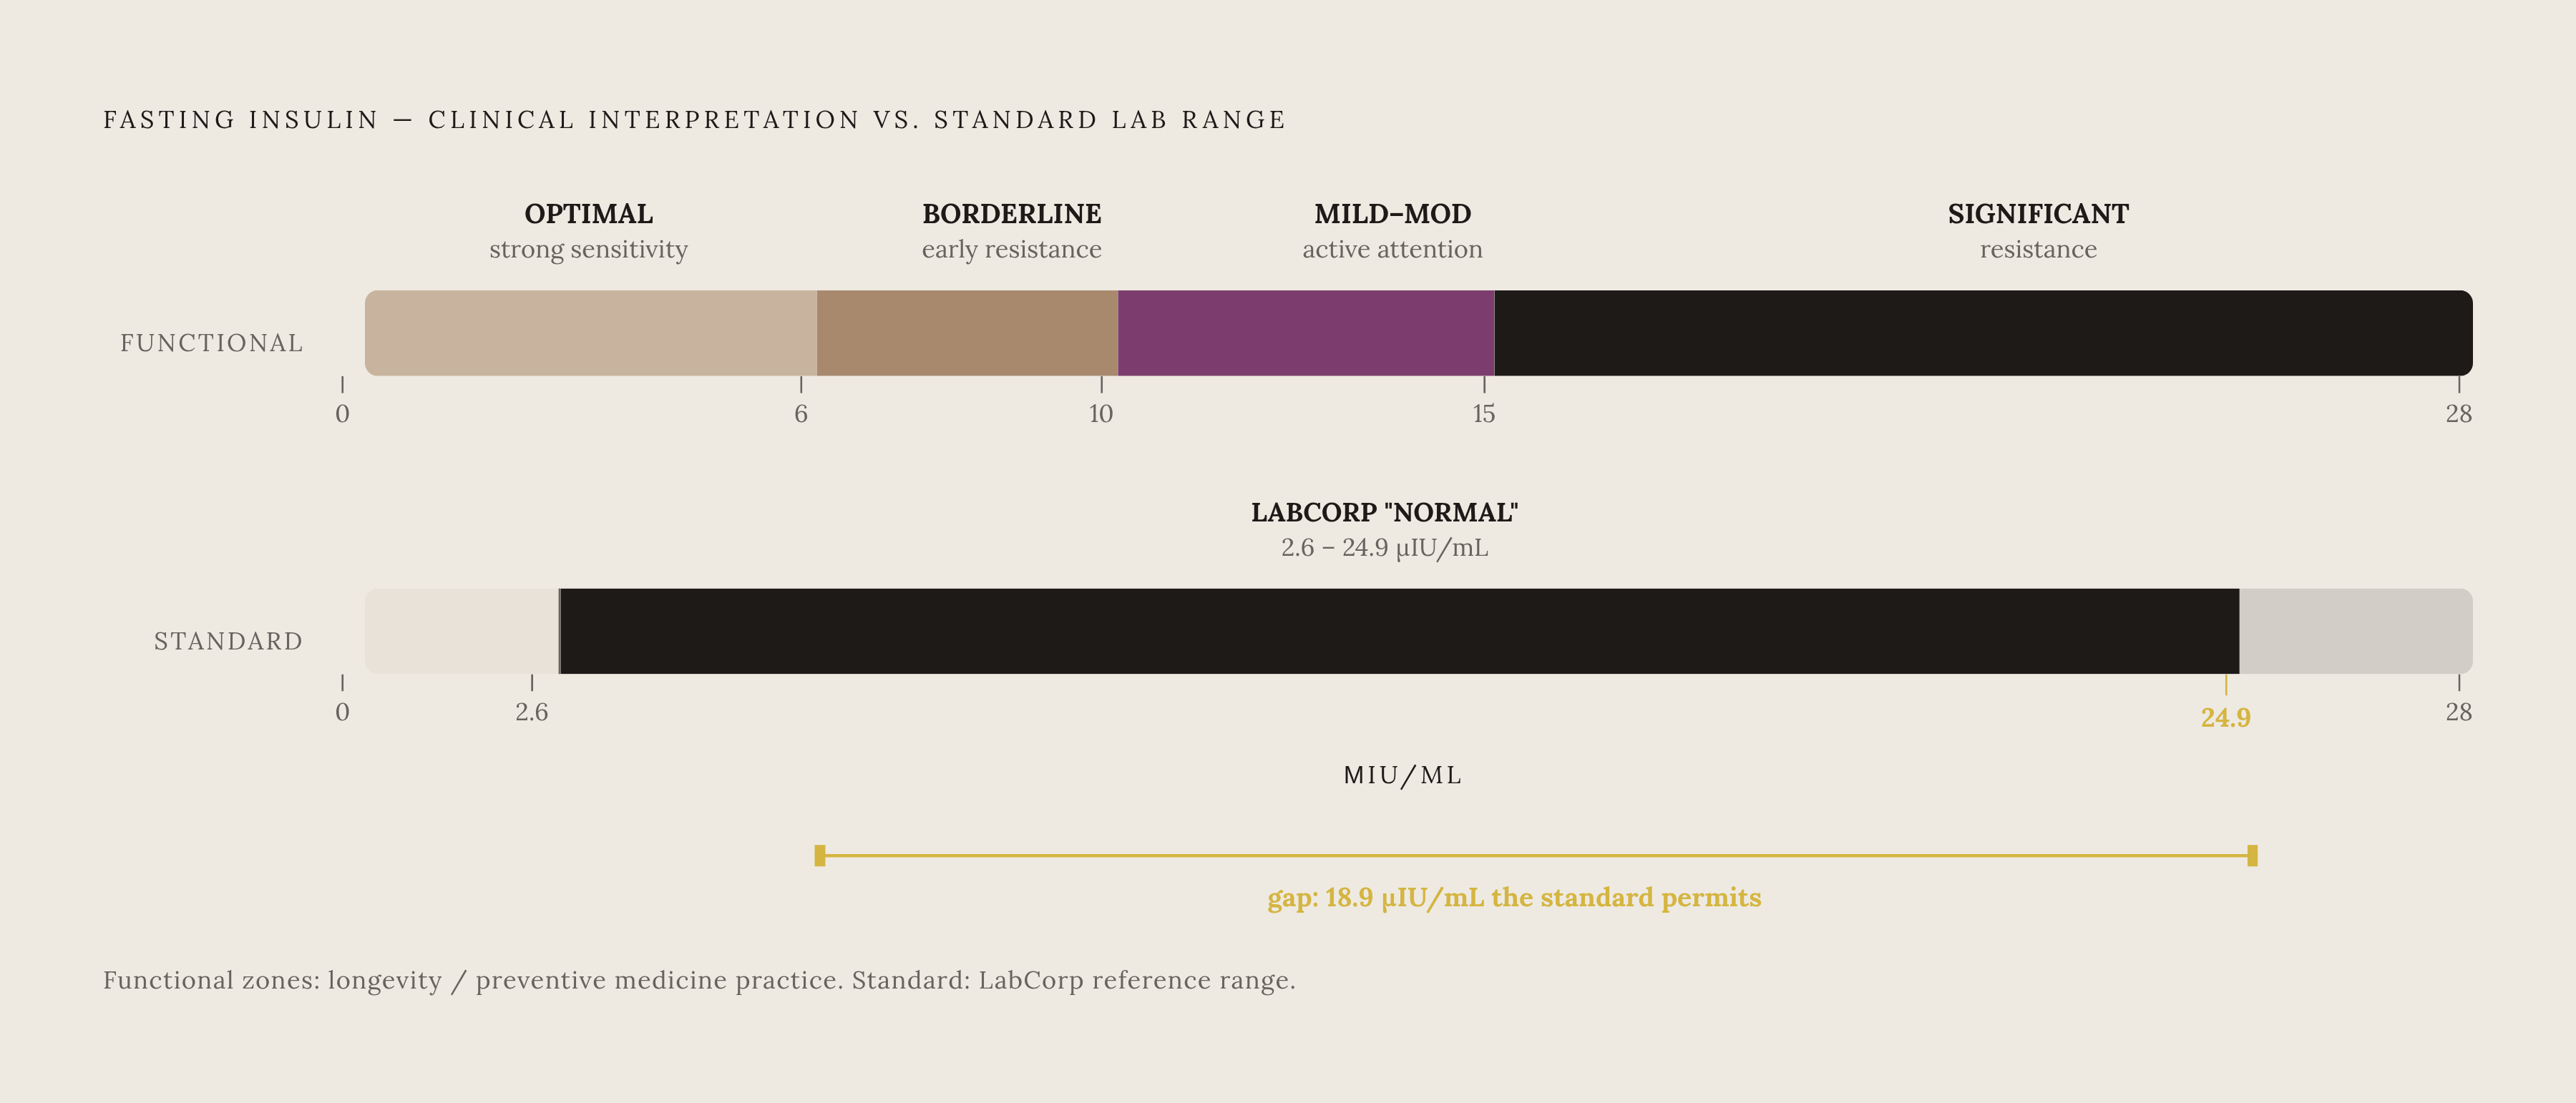
The reference range printed on a standard lab report is wide, wide enough to let real insulin resistance slide through as "normal." That range was built from population averages, and in a population where metabolic dysfunction is already common, the average stops being a useful marker of health.
A result can sit comfortably inside the lab's normal range, but it can still carry meaningful metabolic risk from a longevity or functional medicine standpoint. LabCorp's standard range for fasting insulin runs from 2.6 to 24.9 µIU/mL, but the upper limit shifts depending on the lab, and most standard ranges go out to somewhere around 20 to 25 µIU/mL. Clinicians working in preventive and longevity medicine read that same scale a different way. Their working gradient treats roughly 2 to 6 µIU/mL as optimal, because insulin sensitivity is strong there. The 6 to 10 range is borderline territory, where early resistance is plausible. The 10 to 15 range signals mild to moderate resistance that calls for active attention. Anything above 15 µIU/mL counts as significant resistance in this framework. Sex-based differences in these thresholds affect where risk actually begins, and a single range applied to everyone flattens those differences out.
The most useful single number to calculate from a fasting insulin result is HOMA-IR: fasting insulin multiplied by fasting glucose, divided by a constant. That calculation turns two separate lab values into one composite index of insulin resistance, and it requires drawing both insulin and glucose at the same time; ordering them together is the baseline for a useful panel.
There's a real limitation to sit with here. Insulin immunoassays are not standardized across laboratories the way glucose tests are. Variability within a single assay and between different assay platforms is substantial, so a result of 6 µIU/mL from one lab is not automatically the same as 6 µIU/mL from a lab running a different platform. The optimal thresholds that longevity practitioners use haven't been validated against one universal assay standard, and that stands as the strongest honest objection to the interpretive gradient above.
The practical fix is straightforward. Test at the same lab every time, watch direction and trend rather than anchoring to one absolute number, and always read the result alongside HOMA-IR and the broader clinical picture, not in isolation.
How insulin resistance accelerates biological aging beyond blood sugar
Glucose can stay normal, but elevated insulin doesn't just sit there quietly in the background. It drives cardiovascular, inflammatory, and aging processes even when every other number on the panel looks fine.
The cardiovascular pathway runs through impaired nitric oxide production and vascular inflammation. In insulin resistance, hyperinsulinemia disrupts normal glucose metabolism, and that triggers inflammatory signaling and a rise in pro-inflammatory cytokines. Those cytokines then interfere with nitric oxide synthesis in the walls of blood vessels, which impairs the vessels' ability to dilate and raises oxidized LDL in the process. The Levels guide ties blood sugar dysregulation to eight of the ten leading pre-COVID causes of death in the United States, a list that includes cardiovascular disease, stroke, cancer, Alzheimer's disease, and kidney disease.
Insulin resistance also drives a specific pattern of lipid abnormality: elevated ApoB, more small dense LDL particles, and high triglycerides. So that pattern accelerates atherosclerosis even in people whose standard cholesterol panel reads as acceptable.
A newer line of evidence connects this directly to biological aging. The TyG index, a surrogate measure of insulin resistance built from triglycerides and fasting glucose, is independently associated with phenotypic age acceleration. Zhao and Liang, writing in Frontiers in Physiology, analyzed a large adult cohort from NHANES and found that each unit increase in TyG index tracked with a meaningful rise in PhenoAgeAccel, the gap between a person's biological age and their chronological age. That association grew stronger above a certain TyG threshold. PhenoAgeAccel has been validated elsewhere as a predictor of disease and early death, so metabolic dysfunction visible in a routine blood draw is pushing the biological clock forward in real time.
Cellular senescence closes the loop. Insulin resistance encourages senescent cells to accumulate, those senescent cells release inflammatory cytokines, and those cytokines worsen insulin resistance further, round after round. The Levels guide describes how senescent cells release cytokines that spread inflammation to neighboring cells, and that is how they drive age-related tissue dysfunction and feed the development and progression of type 2 diabetes. A reader who walked into this section thinking of fasting insulin as a diabetes marker should walk out seeing it as something closer to a dashboard light for the whole aging process.
What drives fasting insulin up
Fasting insulin climbs when some sustained input overwhelms the pancreas's capacity to keep cells sensitive to its signal. Several inputs usually stack together, which is a big part of why no single lifestyle change reliably undoes resistance once it's established.
Diet is the most direct lever available. Diets heavy in refined carbohydrates and added sugar keep post-meal insulin chronically elevated, and over time that steady demand trains cells to turn down their own insulin receptor sensitivity. The Levels guide names cutting added sugars and refined carbs as one of the central behavioral levers for metabolic health. Total calorie excess matters on its own too, separate from what those calories are made of. Extra calories build up as visceral fat, and visceral fat is a major driver of resistance in both the liver and peripheral tissue.
Sleep deserves more weight than most people give it. The Levels guide puts seven to eight hours a night as the range tied to optimal metabolic health, and it notes that if you sleep too little or too much, your mortality risk rises. Poor sleep raises cortisol quickly and blunts insulin sensitivity along with it, making it one of the fastest ways fasting insulin can shift upward with no change to diet.
Physical inactivity cuts into skeletal muscle's role as the body's main site for clearing glucose from the blood. If muscle is less active, any given amount of insulin does less work, so the pancreas compensates by producing more. Sarcopenia, the loss of muscle mass that comes with age, makes this worse: a smaller muscle volume means a smaller glucose sink, which raises the insulin demand needed to hold glucose steady.
Visceral fat works as both cause and effect in this picture. In insulin-resistant states, visceral fat releases free fatty acids and adipokines that get in the way of the liver's insulin signaling, but subcutaneous fat under the skin doesn't do this. Visceral fat is the metabolically active tissue driving the inflammatory cascade described earlier.
Smoking belongs on this list too, flagged by the Levels guide as a known disruptor of metabolic health, even if it plays a smaller role here than diet, sleep, and activity. Some factors sit further out of reach: genetic variation in how well beta cells function, the natural age-related slowdown in how the liver clears insulin, and hormonal shifts like declining sex hormones or rising cortisol reactivity later in life. These set a baseline level of difficulty for some people more than others. They make catching the problem early more important, not less, because the modifiable drivers still carry real weight no matter where someone starts genetically.
What the evidence supports for bringing fasting insulin down
The most lasting drops in fasting insulin come from combining lifestyle changes rather than leaning on any one intervention by itself. The exercise research in particular is specific enough now to recommend certain training approaches over others.
Combined aerobic and resistance training beats either one alone. A 2025 Frontiers in Physiology review cited evidence that combined training reduces fasting insulin and HOMA-IR more than resistance training on its own, and it does this even without major shifts in body composition. The benefit isn't just a side effect of losing weight.
For anyone short on time, HIIT holds up as a real alternative. Both HIIT and combined aerobic-plus-resistance training lowered fasting insulin, and there was no meaningful difference between the two approaches. Only the combined aerobic-plus-resistance approach improved HOMA-IR by a statistically significant amount. What that points to is a simpler truth than most people expect: which exercise modality someone picks matters less than whether they keep doing it. Consistency carries more weight than the specific workout format, which is good news for anyone who has written off exercise as a lever because the "optimal" protocol didn't fit their schedule.
Fasting insulin gives an early warning, years ahead of glucose or HbA1c, and it responds to inputs that are largely within a person's control: what they eat, how they sleep, and how consistently they move. The test itself isn't complicated to order or expensive to run. Why wait for glucose to confirm what insulin could have shown years earlier?